
Author: Eric Bretschneider, Ph.D
INTRODUCTION
When considering the potential circadian impact of lighting, lighting designers have a choice between three different models: melanopic equivalent daylight illuminance, or m-EDI [CIE 2018]; equivalent melanopic lux, or EML [WELL v2]; and circadian light, or CLA [UL 2019].
Both m-EDI and EML have a continuous action spectrum, which means that small changes in the spectral stimulus will result in a similarly small change in the calculated parameter. Moreover, m-EDI and EML are perfectly correlated and differ by a single multiplicative constant.
In contrast, the Circadian Stimulus model from which CLA is calculated, is well known for having a discontinuous action spectrum. The discontinuous action spectrum is in fact an inherent feature of the Circadian Stimulus model and is present in all versions of the model since its inception [Rea 2005; Rea 2010; Rea 2012; Rea 2016; UL 2019; Rea 2021]. The existence of the discontinuity in the action spectrum has a potentially profound impact on predictions or measurements made using the Circadian Stimulus model. Notably, if the spectral stimulus is close to the discontinuity, then small changes, even those due to measurement uncertainty, could potentially shift the measured stimulus across the discontinuity, resulting in profound differences in calculated or measured CLA values, and hence the predicted circadian impacts of lighting.
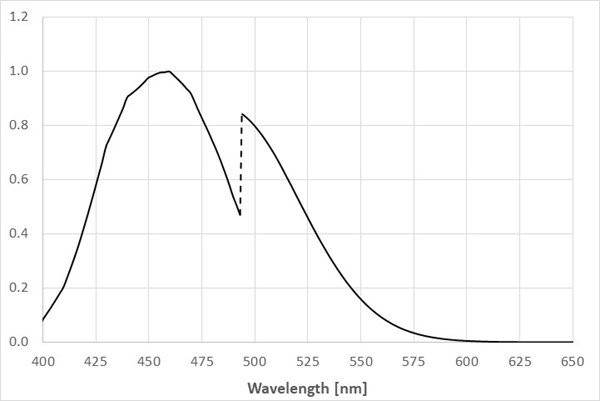
Figure 1. CLA monochromatic action spectrum (source Rea 2016)
DISCUSSION
Despite the presence of the discontinuity in all versions of the Circadian Stimulus action spectrum, the implications of this discontinuity have received little attention in the literature. Esposito and Houser reported that similar spectral power distributions for CCT tunable fixtures with essentially identical values of m-EDI and EML could have CLA values that differed by a factor of 2.76x and CS values that differed by a factor of 2x. [Esposito 2022] These results are shown in Table 1 below. The chromaticity difference between these spectra is Δu’v’ = 0.0012 and would be imperceptible to individuals with normal color vision.
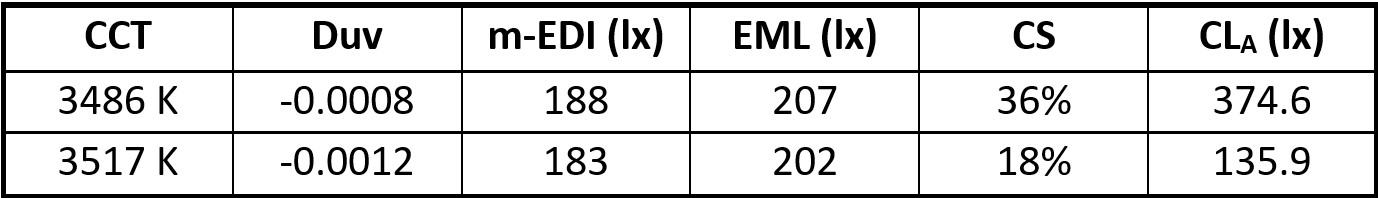
Table 1. Circadian Parameters Near Circadian Stimulus Spectral Discontinuity
While these results highlighted potential issues with tunable fixtures in which the spectral power distribution is deliberately changed, they fail to address unintentional changes in spectral power distribution. The authors of the Circadian Stimulus model appear to have implicitly assumed that with the exception of CCT tunable or color tunable fixtures, the spectral power distribution of lighting fixtures is constant and does not change over time.
This is contrary to the understanding of persons familiar with LED technology in that it is understood that the spectral power distribution of LED packages, and hence fixtures and luminaires, will shift over time.
The fact that the emission spectra of LED packages change slightly over time should come as no surprise to anyone familiar with LED technology, as it was explicitly described in discussed in IESNA LM-80-08 [IES 2008], one of the very first LED standards to be published. LM-80 was first published in 2008 and is a cornerstone document of LED reliability in that it defines test methods and data collection for reliability data of LED packages. LM-80 has always mandated reporting of the chromaticity shift of LEDs over time [IES 2008]. Additionally, Energy Star certification requirements have always included a Color Maintenance specification. Even the first version of the Energy Star Integral Lamps, specification published in 2009, included a chromaticity shift specification of Δu’v’ ≤ 0.007 during the first 6,000 hours of operation. [Estar 2009]
The history of the phenomenon goes back even further, to the first commercial white LEDs based on GaN blue LED chips and a YAG:Ce phosphor. The patents filed that covered this technology highlighted that using a YAG:Ce phosphor reduced, but didn’t eliminate, the color shift over time for white LEDs [Shimizu 1997].
Even ignoring this history, the issues with chromaticity shift of LEDs over time were highlighted in a CALiPER Report published by the U.S. Department of Energy in 2016 [DOE 2016]. This study reported on the chromaticity shift modes of LED PAR38 lamps over time.
This report identified at least four different chromaticity shift modes (CSMs) for LEDs, some of which could be quite complex and included shifts that changed direction over time (i.e., shift towards blue followed by shift towards green, or shift towards blue followed by shift towards yellow).
One complication is that LED packages may exhibit a variety of different types of chromaticity shift behavior [DOE 2016]. A second, more significant factor, is that LED packages may show a rapid but small shift in Δu’v’ that then remains essentially constant for exceptionally long periods of time before beginning to change again [DOE 2013, DOE 2014, Davis 2016]. This long period of stability is known as the incubation period, and the inability to predict the end of the incubation period stymied efforts at chromaticity shift reliability predictions until the publication of ANSI/IES TM-35-19 [IES 2019]. While TM-35 does not allow prediction of the direction of chromaticity shift, it does allow estimation of the magnitude of chromaticity shift over time [DOE 2016, Davis 2016].
To demonstrate the potential effect of chromaticity shift of parameters calculated using the Circadian Stimulus model, the CLA values were calculated using the spectral power distributions[1] of the PAR38 lamps from the CALiPER study [DOE 2016]. This data was collected over approximately 14,000 hours. A constant corneal illuminance of 300 lx was used for all calculations. This limited shifts in calculated parameters to those associated with the changes in the spectral power distribution. The results therefore do not include the effects of lumen maintenance.
The DOE 2016 CALiPER Report mentioned above described the spectral power distributions of 32 individual PAR38 LED lamps operated in steady-state conditions over a time span of approximately 14,000 hours. While the purpose of the report was evaluation of chromaticity shift over time, the spectral data collected represents a unique set of information to evaluate predicted circadian lighting effects over time. Lamps with an initial CCT of about 3500 K were selected, which is consistent with the approximate reported location of the Circadian Stimulus discontinuity [Esposito 2022].
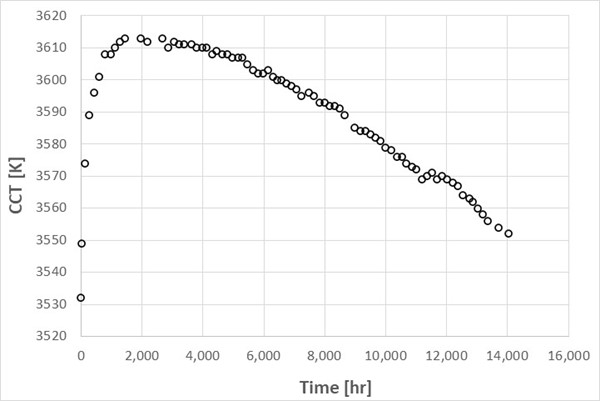
Figure 2. CCT behavior of LED lamps over time. (Source: DOE 2016)
As can be seen in Figure 3 below, this lamp exhibited CSM-4 behavior [DOE 2016], which is an initial chromaticity shift towards the blue followed by a generalized reversal in chromaticity shift direction towards the yellow.
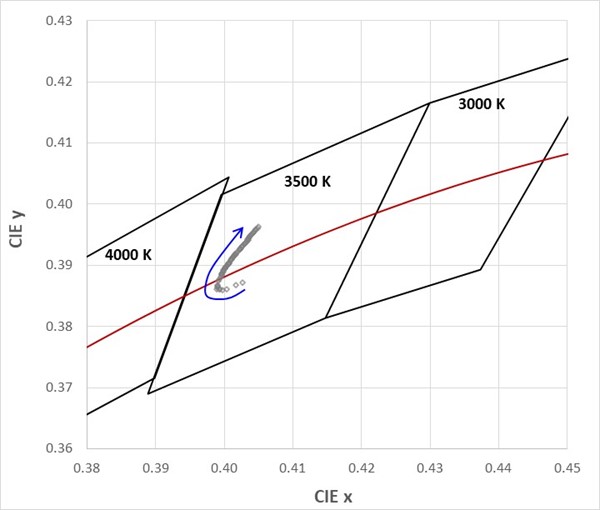
Figure 3. The blue arcing arrow shows one lamp’s chromaticity shift behavior: a shift towards blue, followed by a shift towards yellow. The dark red line represents the Planckian locus. (Source: DOE 2016)
In general, the chromaticity shift of the lamp shown in Figure 3 can be described as a general slow shift to higher Duv values. As the CCT is essentially constant, and the shift overs over a protracted time interval, it is unlikely that this shift would be noticeable to occupants of the illuminated space. Additionally, the chromaticity remains with the central portion of the ANSI 3500 K chromaticity bin and would likely be deemed acceptable over the entire 14,000-hour period of operation.
During initial operation, the chromaticity shift is towards the blue, indicating a relative increase in the amount of blue light from the LED chip relative to the light emitted by the phosphor materials. After about 600 hours of operation, the direction of chromaticity shift begins to change towards the yellow, indicating an increasing fraction of light coming from the phosphor materials relative to the LED chip.
The spectral power distribution at each time interval was used to calculate CLA [Rea 2016] as a function of time. Over the first 1,000 hours of operation, which includes the initial blue shift and the transition to a yellow shift, the CLA value increases by about 5% and then slowly declines over the next 10,000 hours of operation, reaching a minimum of about 92% of the initial CLA value.
After about 11,000 hours of operation, the changes in the spectral power distribution shift the lamp across the Circadian Stimulus discontinuity, and the CLA value increases dramatically by more than 160%, from 127.4 lx to 335.1 lx. This behavior is in stark contrast to m-EDI, which is essentially constant over the entire time interval. (See Figure 4 and Figure 5.)
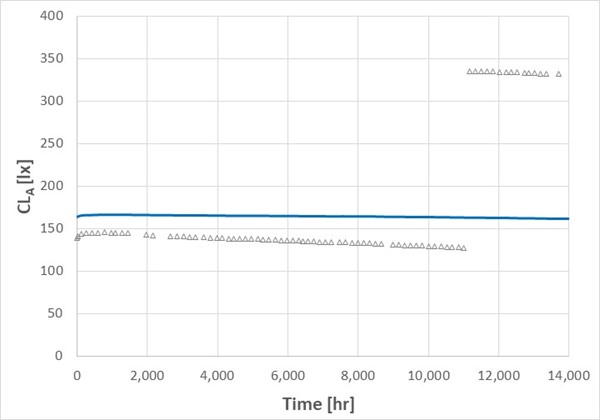
Figure 4. Gray triangles: CLA as a function of time for lamp K2. The blue line shows m-EDI as a function of time. (Source: DOE 2016)
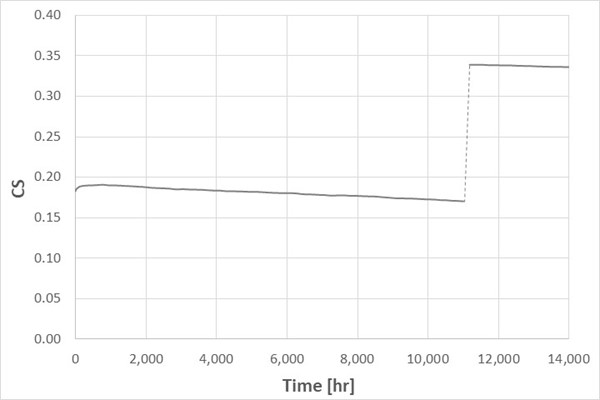
Figure 5. CS as a function of time for lamp K2. (Source: DOE 2016)
Because the discontinuity in the blue-yellow opponency mechanism of the Circadian Stimulus model is abrupt, the transition to higher CLA is both instantaneous and metameric, meaning that two light sources with essentially the same CCT and same appearance have quite different CS values.
Important: According to all versions of the Circadian Stimulus model, the difference of a single photon in a spectral power distribution is sufficient to differentiate between spectral stimuli that are blue dominated and yellow dominated. At the discontinuity, the value of CS increases by almost a factor of 2x from 0.171 to 0.338.
UL DG 24480 has three circadian effective design criteria: CS ≥ 0.30 (primary design criteria), CS ≤ 0.20 during the evening, and CS ≤ 0.10 at night [UL 2019]. Thus, the lamp results above for the first 11,000 hours of operation would comfortably meet the evening circadian design criteria of CS ≤ 0.20. However, after operating for a slightly longer period of time, the same lamp, being operated in the same environment and at the same location would abruptly transition to easily meeting the primary design criteria of CS ≥ 0.30. Further, even though the change in calculated the CS was severe and abrupt, the space would not look any different to the occupants because the change in light’s spectrum was miniscule.
Even if all lamps of the same model exhibited the identical chromaticity shift behavior, the initial chromaticity of each lamp would vary to some degree, which would lead to otherwise identical products crossing the Circadian Stimulus discontinuity at different points of their operational life. Moreover, it is possible that some lamps would never cross the discontinuity.
The complexity and severity of this problem is further demonstrated by evaluating the behavior of another lamp from the DOE CALiPER study [DOE 2016]. This lamp exhibited a behavior trend almost opposite that of the previous lamp. The chromaticity first shifted towards the yellow and then shifted towards the blue (see Figure 6).
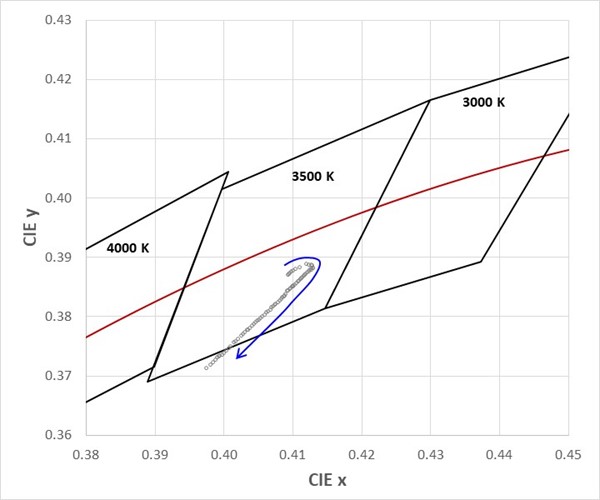
Figure 6. The blue arcing arrow shows a different lamp’s chromaticity shift behavior shift towards yellow, followed by a shift towards the blue. The dark red line is the Planckian locus. Data is for lamp H2. (Source: DOE 2016)
This lamp had an initial CCT of about 3380 K, placing it in the approximate vicinity of the reported locus of the Circadian Stimulus discontinuity [Esposito 2022]. The apparent simplicity of the chromaticity shift behavior of this lamp hides a much more complex behavior. As before, the spectral power distributions collected over time were analyzed to calculate CLA. Plotting CLA as a function of time demonstrates that this particular lamp would cross the Circadian Stimulus discontinuity not once but twice during its operational life. While for the majority of its operational life, the spectrum of the lamp would be blue dominant, for a brief period of time between 1,100 hours and 1,400 hours, the lamp crosses the Circadian Stimulus discontinuity (see Figure 7), and the spectral output is yellow dominant. This behavior again stands in stark contrast with m-EDI, which remains largely constant over the entire time span.
Figure 7. CLA as a function of time for lamp H2. This lamp crossed the blue-yellow discontinuity of the Circadian Stimulus model twice, at 1,102 and 1,440 hours. The blue line shows m-EDI as a function of time. (Source: DOE 2016)
These examples illustrate a significant issue with any design calculations or measurements made using the Circadian Stimulus model, namely the fact that at best, any results represent a snapshot in time and cannot be assumed to be valid for an extended period. Critically, the phenomenon of chromaticity shift over lifetime is not unique to LED lighting products. CFL products are also known to exhibit chromaticity shifts over time (see Figure 8).
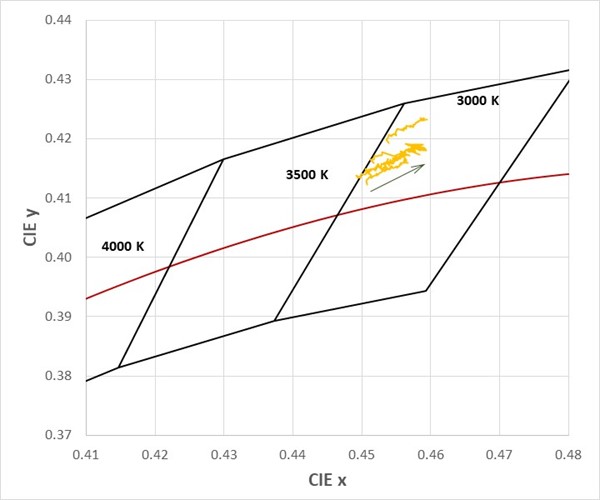
Figure 8. The arrow shows the chromaticity shift of CFL products as a function of time. (Source: DOE 2016)
Even the spectral power distribution of halogen lighting products changes over operating life, with some products exhibiting complex behaviors. CALiPER reports on reliability data of halogen lighting products has shown that different examples of the same halogen lamp can exhibit one of three different chromaticity shift behaviors: a gradual shift towards lower CCT (shift towards yellow); a gradual shift towards lower CCT, followed by a rapid shift to higher CCT (slow shift towards yellow followed by rapid shift towards blue); or a gradual shift towards a higher CCT, followed by a gradual shift towards a lower CCT, followed by rapid shift towards a higher CCT (slow shift towards blue, followed by slow shift towards yellow, followed by rapid shift towards blue) [DOE 2016].
While it can be argued that the example CFL lamp above and halogen lamps in general are sufficiently far from the Circadian Stimulus discontinuity so as to ensure stable predictions or measurements with respect to the Circadian Stimulus model, that assumption would only be valid if the reflectors and lenses in fixtures and luminaires were true achromatic optical elements that did not change the relative spectral power distribution of the light sources.
It is further noted that the concept of dirt depreciation in the past has implicitly been assumed to be achromatic in nature. Given the discontinuous action spectrum of the Circadian Stimulus model, this assumption must be discarded. It is entirely possible for light fixtures on the cusp of the discontinuity to emit blue dominated spectra or yellow dominated spectra depending on how long it has been since their last cleaning. Yet another complication is that dirt accumulation (and hence spectral shift) may not be constant for all fixtures. As seen below, even otherwise identical fixtures installed side by side may experience different degrees of dirt accumulation.
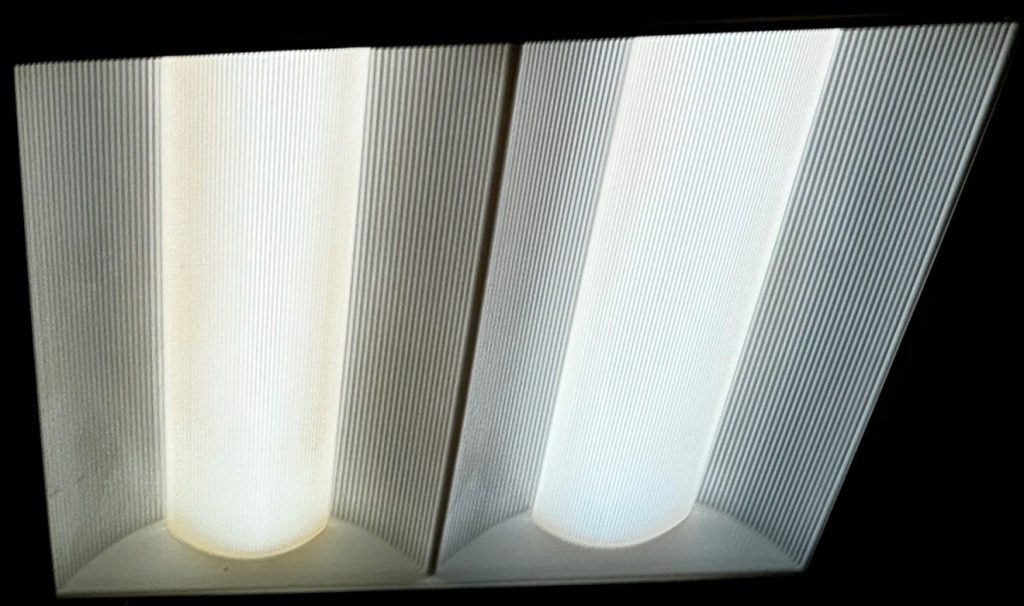
Figure 9. Appearance of fixtures due to differential dirt depreciation.
A further complication would exist for any environment which uses any amount of daylight harvesting. Indeed, lighting designers should be seeking to maximize daylight harvesting, as it is the ultimate in energy efficiency (at least when it’s available). The use of Circadian Stimulus parameters in designs employing daylight harvesting will depend on several continually varying conditions: the current weather, time of day, calendar season, and cleanliness of the windows.
A particularly troubling issue with this uncertainty is that an action spectrum discontinuity has been present in every version of the Circadian Stimulus model since it was first published in 2005 [Rea 2005; Rea 2010; Rea 2012; Rea 2016; UL 2019; Rea 2021]. Despite this, in the almost 20 years since that the model was first published, the developers have virtually ignored the implications of the discontinuity and have failed to even attempt to define the locus of chromaticity coordinates where it could be a potential concern.
As such, there are no guidelines for lighting designers on how to avoid or circumvent potential issues with the Circadian Stimulus discontinuity. A designer’s best option to ensure that desired circadian lighting goals are achieved is to install dimmable fixtures and significantly over-illuminate an area (to ensure CS ≥ 0.30), or significantly under-illuminate an area (to ensure CS ≤ 0.20). Unfortunately, this means dramatically increasing the energy for lighting in the first scenario and potentially providing inadequate illumination in the second scenario.
CONCLUSIONS
In summary, since all current forms of lighting technology exhibit shifts in spectral power distribution over time, any designs, predictions, or measurements made using the Circadian Stimulus model are at best a snapshot in time and cannot be assumed to represent the circadian effect of the lighting system in the future. This issue is of especial concern regarding designs or field measurements made using UL DG 24480. At best, those designs and field measurements would represent a snapshot in time. Therefore, ensuring that circadian lighting goals are met in an energy efficient manner would require frequent, repeated field measurements.
As it is highly likely that the cost of such an ongoing campaign of field measurement would greatly exceed any potential energy savings, until such a time as the locus of the discontinuity is adequately mapped, it is unlikely that circadian designs or measurements based on the Circadian Stimulus model can be justified based on economic considerations.
Additionally, UL recently announced their Circadian Product iQ service [UL 2024], which is largely based on the so-called standard observer methodology [Rea 2023]. As the circadian parameters based on the Circadian Stimulus model are presumably based on measurements of new products, designers have no ability to judge when or even if the spectral power distribution of products due to aging effects of dirt depreciation will shift across the discontinuity and render the Circadian Product iQ rating invalid.
For the reasons discussed here, extreme caution is warranted when using the Circadian Stimulus model for design purposes or field measurements.
REFERENCES
CIE 2018 International Commission on Illumination (CIE). CIE S 026/E: 2018: CIE System for Metrology of Optical Radiation for ipRGC Influenced Responses to Light. In Vienna, Austria: CIE Central Bureau 2018. DOI: 10.25039/S926.2918.
Davis 2016 L Davis, B Yaga, C Johnson, K Mills. The Causes of Color Shift in LED Devices. Phosphor Global Summit, March 8, 2016.
DOE 2013 U.S. Department of Energy. Gateway Demonstrations: Color Maintenance of LEDs in Laboratory and Field Applications. PNNL-22759, September 2013.
DOE 2014 U.S. Department of Energy. Solid-State Lighting Technology Fact Sheet: LED Color Stability. PNNL-SA-101828, March 2014.
DOE 2016 U.S. Department of Energy. CALiPER Report 20.5: Chromaticity Shift Modes of LED PAR38 Lamps Operating in Steady-State Conditions. PNNL-25201, February 2016.
EStar 2009 Energy Star Program Requirements for Integral Lamps Version 1.0, December 2009.
Esposito 2022 Esposito T, Houser K. Correlated color temperature is not a suitable proxy for the biological potency of light. Sci Rep 12, 20223 (2022). DOI:10.1038/s41598-022-21755-7.
IES 2008 Illuminating Engineering Society. IESNA LM-80-08. Approved Method: Measuring Lumen Maintenance of LED Light Sources. ISBN 978-0-87995-227-3, September 2008.
IES 2019 Illuminating Engineering Society. ANSI/IES TM-35-19. Technical Memorandum: Projecting Long-Term Chromaticity Coordinate Shift of LED Packages, Arrays, and Modules. ISBN 978-0-87995-082-8, November 2019.
Rea 2005 Rea MS, Figueiro MG, Bullough JD, Bierman A. A model of phototransduction by the human circadian system. Brain Research Reviews 2005; 50: 213–228.
Rea 2010 Rea MS, Figueiro MG, Bierman A, Bullough JD Circadian light. Journal of Circadian Rhythms 2010; 8:2. DOI: 10.1186/1740-3391-8-2.
Rea 2012 Rea MS, Figueiro MG, Bierman A, Hamner R Modelling the spectral sensitivity of the human circadian system. Lighting Res. Technol. 2012; 44: 386-396.
Rea 2016 Rea MS, Figueiro MG Light as a circadian stimulus for architectural lighting. Lighting Res. Technol. 2016; 0: 1-14. DOI: 10.1177/1477153516682368.
Rea 2021 Rea MS, Nagare R, Figueiro MG Modeling Circadian Phototransduction: Quantitative Predictions of Psychophysical Data. Front. Neurosci. 2021; 15:615322. DOI: 10.3389/fnins2021.615322.
Rea 2023 Rea M, Bierman A, Thayer A, Jarboe C, Figueiro M. Standard observer watts: Evaluating the efficiency of circadian-effective luminaires using a standard observer methodology. Lighting Research & Technology. 2024;56(2):156-168. DOI:10.1177/14771535221145606.
Shimizu 1997 Y Shimizu, K Sakano, Y Noguchi, T Moriguchi. U.S. Patent No. 5,998,925, Light Emitting Device Having a Nitride Compound Semiconductor and a Phosphor Containing a Garnet Fluorescent Material. Filed July 29, 1997.
UL 2019 Underwriters Laboratories. UL DG 24480: Design Guideline for Promoting Circadian Entrainment with Light for Day-Active People, First Edition, 2019.
UL 2024 UL Solutions. Human-centric lighting. Online: https://www.ul.com/services/human-centric-lighting. (Accessed 2024 Jun 18).
WELL v2 International WELL Building Institute. WELL v2, 2020. Online: https://well.support/download-the-enhanced-accessibility-version-of-the-well-standard~0a33776a-0700-4d80-a066-7411836f11ab. (Accessed 2024 Jun 18).
0 Comments